Rubio Visit, New MPG and IRI Polls, Hidden Votes and Why Are You Alive? | Ep 550, May 24, 2026 [EP550]
Posted on Wednesday, May 27, 2026 | Category: Armenia, Politics, Poll, Armenian Church, Nagorno Karabakh, Armenian Genocide, Azerbaijan, Russia, China | Series: wir, video
Groong Links:
Topics:
- Rubio’s sudden Armenia visit
- Polls diverge before election
- Hidden vote raises questions
- TRIPP remains deeply polarizing
- “Western Azerbaijan” pressure grows
- Opposition faces arrests, threats
- “Why are you alive?” campaign rhetoric
Episode 550 | Recorded: May 25, 2026
#ArmeniaElections #Armenia #NikolPashinyan #TRIPP #ZangezurCorridor #WesternAzerbaijan #ArmenianOpposition
Show Notes
Summary
This Week in Review examines the tightening political climate in Armenia ahead of the June 2026 parliamentary elections. Asbed and Hovik discuss Marco Rubio’s sudden Armenia visit, new polling from IRI, MPG, and CAEAC, and what the wide gaps in voter disclosure may reveal about hidden opposition support. The episode also covers TRIPP, “Western Azerbaijan” rhetoric, public trust in the Armenian Apostolic Church, and the growing use of arrests, threats, and state pressure against opposition figures. The discussion centers on Pashinyan’s escalating campaign rhetoric, including his “Why are you alive?” outburst, and what it signals about the stakes of the coming election.Key Questions Discussed
Rubio’s Visit to Armenia
- Why was Marco Rubio’s visit to Armenia announced so suddenly?
- What might be the purpose of the signing ceremony after his meeting with Ararat Mirzoyan?
- Is the visit tied to TRIPP, Iran, US-China talks, or Russia’s changed position?
- Why did Russia and Iran become more vocal against TRIPP after earlier relative silence?
- Is the visit meant to boost Pashinyan before the election, or is there a larger regional agenda?
Election Polls: MPG
| Index | Value |
|---|---|
| Hidden Vote Index | 12.0% |
| Participation Sensitivity Gap | 5.0% |
| Participation Certainty Index | 73.3% |
| Civil Contract Share | 28.8% |
| Combined Opposition Share | 44.9% |
- Why do recent Armenian election polls show such different results?
- What does the MPG poll suggest about opposition turnout and coalition math?
- Why does the IRI poll show much higher undecided and refused categories?
- Does the “hidden vote” pattern suggest voters are less willing to reveal opposition support to some pollsters?
- Could polling method, timing, or sponsor identity shape who answers and how they respond?
IRI Poll and Public Trust
| Index | Value |
|---|---|
| Hidden Vote Index | 44% |
| Participation Sensitivity Gap | 43% |
| Participation Certainty Index | 92% |
| Civil Contract Share | 32% |
| Combined Opposition Share | 11% |
- Why do recent Armenian election polls show such different results?
- How can 61% say Armenia is moving in the right direction while only 32% name Civil Contract as their vote choice?
- How can 40% say they trust no politician while 62% are satisfied with the Prime Minister’s Office?
- Why does the Armenian Apostolic Church remain highly rated despite Pashinyan’s public attacks on it?
- What does the split over TRIPP tell us about public concern over Syunik, security, and sovereignty?
“Western Azerbaijan” and Settlement Claims
- Why is the “Western Azerbaijan” issue becoming central in the election campaign?
- What does Aliyev’s demand for negotiations over the “return” of Azerbaijanis to Armenia mean?
- Why are opposition claims about potential Azerbaijani settlement in Armenia being challenged or “fact-checked”?
- Does Pashinyan’s record give voters reason to trust his denials?
Arrests, Threats, and Campaign Pressure
- Why was Andranik Tevanyan arrested weeks before the election?
- What is the significance of the state moving against the 7or.am media platform?
- What does the death of Armen Hovannisyan in custody suggest about state handling of election-related dissent?
- Why was Arthur Osipyan arrested after confronting Pashinyan?
- What does Pashinyan’s “Why are you alive?” outburst reveal about the tone of the campaign?
- What should be made of Pashinyan’s threat to nationalize Gagik Tsarukyan’s Ararat Cement factory?
Poll Integrity Dashboard - Why We Introduced These Metrics
Most discussions about polls focus only on the headline numbers:
- Who is leading?
- Who is losing?
- By how much?
But we noticed something else in recent Armenian polls. Different polls were not only giving different political results, they also seemed to show different patterns in how people answered questions.
So we introduced a few simple measures to look at what may be happening behind the scenes.
Hidden Vote Index (HVI)
This measures the share of people who do not give a clear answer when asked who they would vote for.
Examples:
- “I don’t know.”
- “I prefer not to answer.”
- “Undecided.”
- Refusing to answer the question.
This helps answer:
How many voters are hidden from view?
Simple example:
Poll A:
- Government: 30%
- Opposition: 20%
- Hidden voters: 10%
Poll B:
- Government: 30%
- Opposition: 20%
- Hidden voters: 40%
Even though the headline numbers look identical, Poll B leaves much more unanswered.
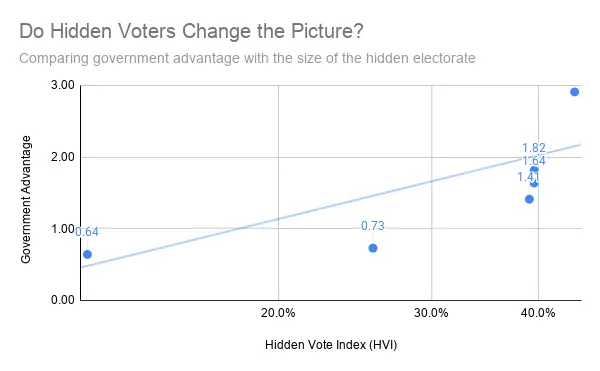
Hidden Votes vs. Government Advantage in 6 Recent Armenian Polls
This plot from 6 recent polls (2 each from MPG, IRI, and EVN) suggests a possible relationship between the size of the hidden electorate and the government’s relative advantage in the polls. As the Hidden Vote Index increases, Government Advantage also appears to increase, shown by the upward trend line. Polls with smaller hidden-vote groups, such as the MPG polls, tend to show stronger opposition performance and lower government advantage. Meanwhile, polls with larger hidden-vote groups, such as EVN and especially IRI, tend to show larger government leads. This does not prove that hidden voters support the opposition.
However, it raises an interesting question: when a larger share of respondents avoid revealing their political preference, are polls measuring only political support, or also differences in how comfortable people feel answering sensitive political questions?
Participation Sensitivity Gap (PSG)
This compares two questions:
- “Will you vote?”
- “Who will you vote for?”
Simple example:
Question:
Will you vote?
- 95% answer
- 5% avoid answering
Question:
Who will you vote for?
- 60% answer
- 40% avoid answering
Gap:
40% − 5% = 35%
This helps answer:
Are people comfortable talking about elections, but less comfortable saying who they support?
Participation Certainty Index (PCI)
This measures how many people say they are likely to vote.
Examples:
- “Definitely will vote”
- “Probably will vote”
This helps answer:
How serious and committed do people seem about participating?
Simple example:
Poll A:
- Definitely vote: 70%
- Probably vote: 15%
PCI: 85%
Poll B:
- Definitely vote: 45%
- Probably vote: 10%
PCI: 55%
Poll A suggests a more motivated electorate.
Important Note
These numbers themselves do not provide an ultimate proof of what is happening, but in an environment of manipulation, fear and intimidation, they provide hypotheses that can be tested in the future.
They give us another way to look at polls, because sometimes the interesting story is not only what people say, but also how willing they are to say it.
MPG Poll Review Slides
| Index | Value |
|---|---|
| Hidden Vote Index | 12.0% |
| Participation Sensitivity Gap | 5.0% |
| Participation Certainty Index | 73.3% |
| Civil Contract Share | 28.8% |
| Combined Opposition Share | 44.9% |
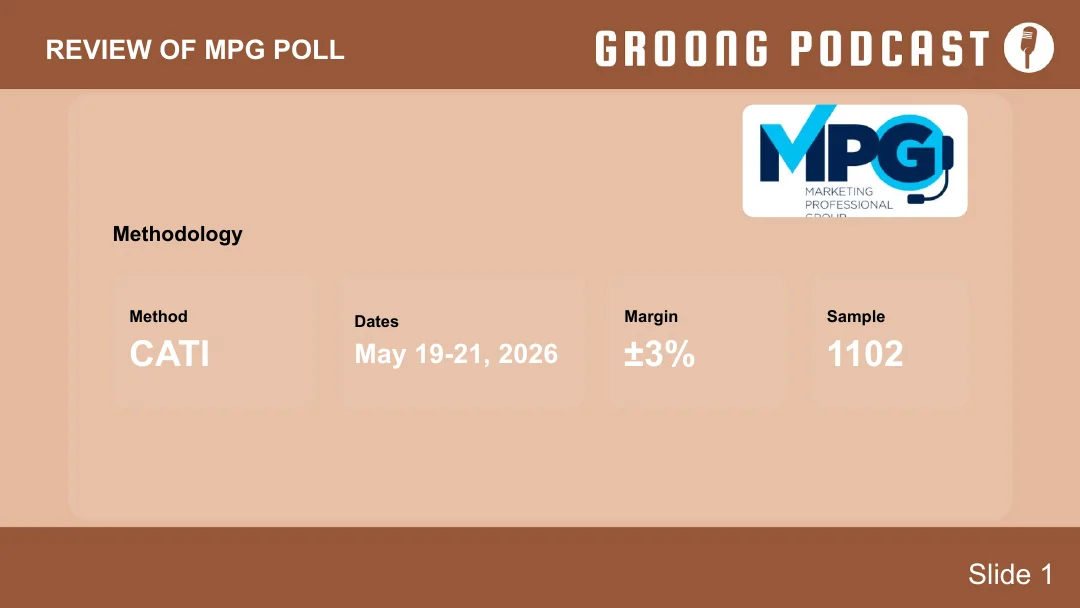
Slide 1: MPG Methodology
The MPG poll was conducted by CATI from May 19-21, 2026, with a sample of 1,102 respondents and a ±3% margin of error. This poll was fielded closer to election day than the IRI poll, which matters when comparing voter certainty and disclosure patterns.
- Method: CATI
- Dates: May 19-21, 2026
- Margin: ±3%
- Sample: 1,102
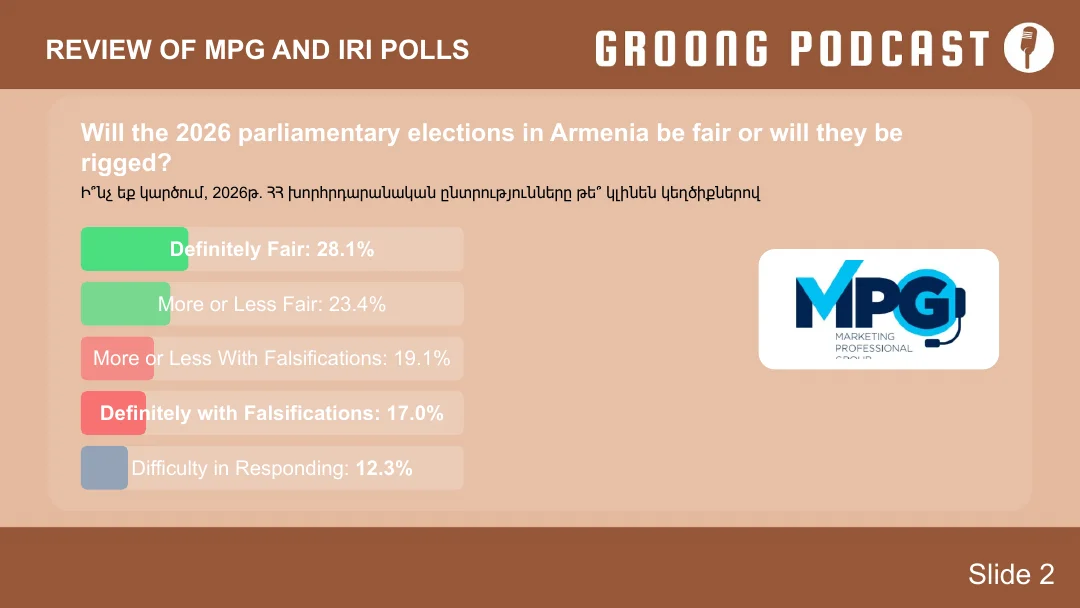
Slide 2: Fair or Rigged Election?
MPG asked whether the 2026 parliamentary elections in Armenia will be fair or rigged. A combined 51.5% said the election would be definitely or more-or-less fair, while 36.1% expected some level of falsification. Another 12.3% had difficulty responding.
| Response | Share |
|---|---|
| Definitely fair | 28.1% |
| More or less fair | 23.4% |
| More or less with falsifications | 19.1% |
| Definitely with falsifications | 17.0% |
| Difficulty responding | 12.3% |
Key point: Even in a poll where Civil Contract leads, more than one-third of respondents expect falsifications, and another 12.3% avoid a clear answer.
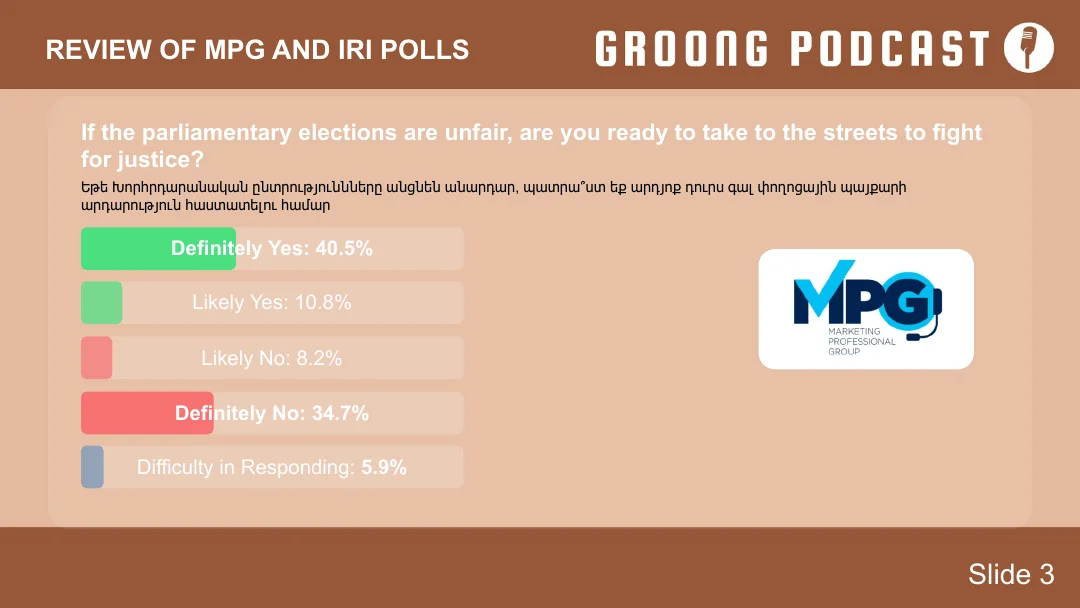
Slide 3: Readiness to Protest Unfair Elections
MPG also asked whether respondents would take to the streets if the elections were unfair. 51.3% said definitely or likely yes, while 42.9% said likely or definitely no.
| Response | Share |
|---|---|
| Definitely yes | 40.5% |
| Likely yes | 10.8% |
| Likely no | 8.2% |
| Definitely no | 34.7% |
| Difficulty responding | 5.9% |
Key point: A narrow majority says they are ready to protest unfair elections. This gives the election-fairness question direct political weight.
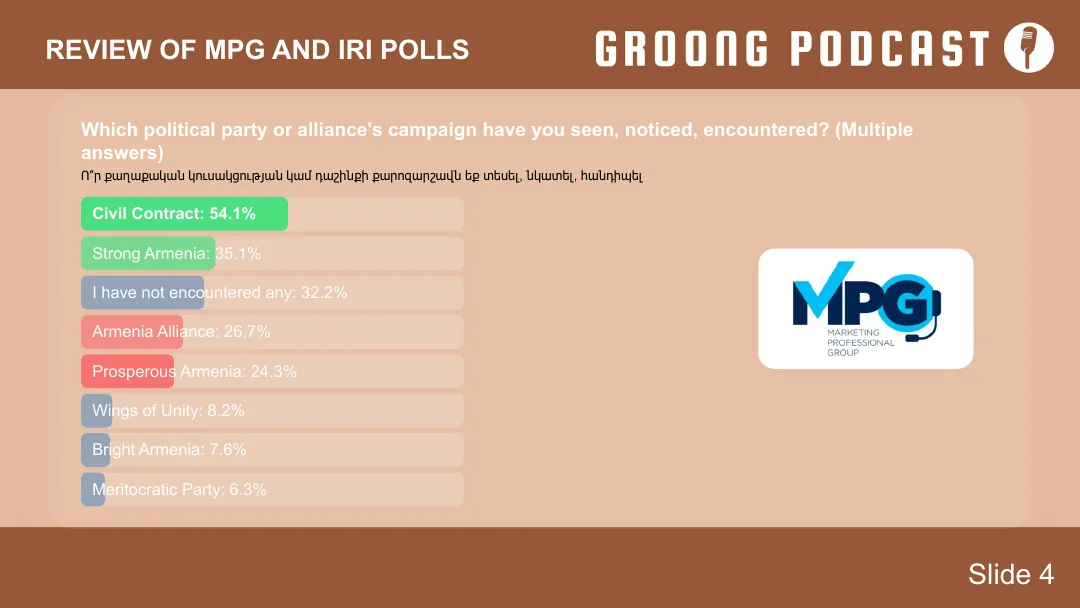
Slide 4: Campaign Visibility
Civil Contract has the highest reported campaign visibility at 54.1%, followed by Strong Armenia at 35.1%. A large share, 32.2%, said they had not encountered any campaign.
| Party / Alliance | Campaign Seen |
|---|---|
| Civil Contract | 54.1% |
| Strong Armenia | 35.1% |
| I have not encountered any | 32.2% |
| Armenia Alliance | 26.7% |
| Prosperous Armenia | 24.3% |
| Wings of Unity | 8.2% |
| Bright Armenia | 7.6% |
| Meritocratic Party | 6.3% |
Key point: Civil Contract has a strong visibility edge, but opposition visibility is still broad across several parties.
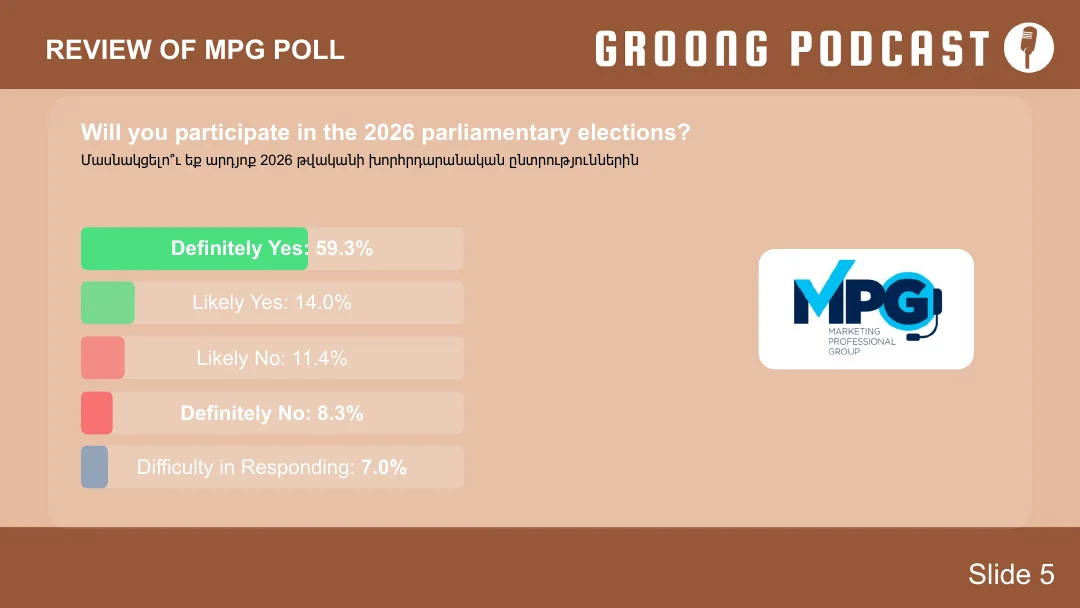
Slide 5: Election Participation
MPG found 73.3% likely participation, combining 59.3% definitely yes and 14.0% likely yes. This contrasts with the IRI poll’s much higher stated participation level, which was one of the major differences discussed in the episode.
| Response | Share |
|---|---|
| Definitely yes | 59.3% |
| Likely yes | 14.0% |
| Likely no | 11.4% |
| Definitely no | 8.3% |
| Difficulty responding | 7.0% |
Key point: MPG shows high turnout intent, but not the extreme participation certainty seen in IRI.
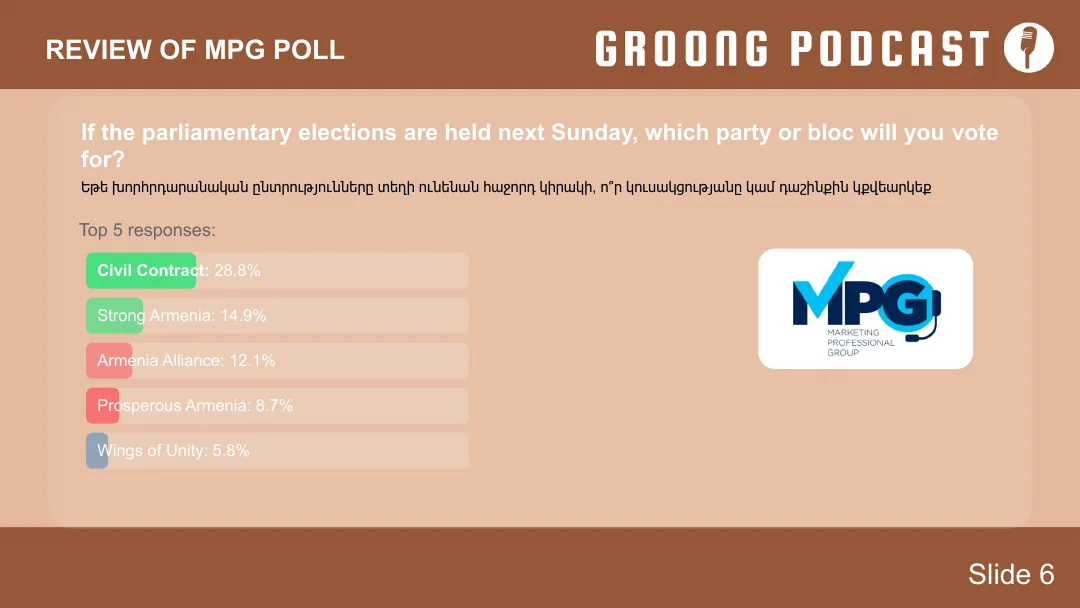
Slide 6: Party Preference, MPG
The MPG vote-choice results show Civil Contract ahead at 28.8%, but with several opposition forces also clearing or approaching meaningful parliamentary strength.
| Party / Bloc | Vote Share |
|---|---|
| Civil Contract | 28.8% |
| Strong Armenia | 14.9% |
| Armenia Alliance | 12.1% |
| Prosperous Armenia | 8.7% |
| Wings of Unity | 5.8% |
Key point: Civil Contract leads, but the combined opposition vote among the top four opposition forces is larger than Civil Contract’s topline vote.
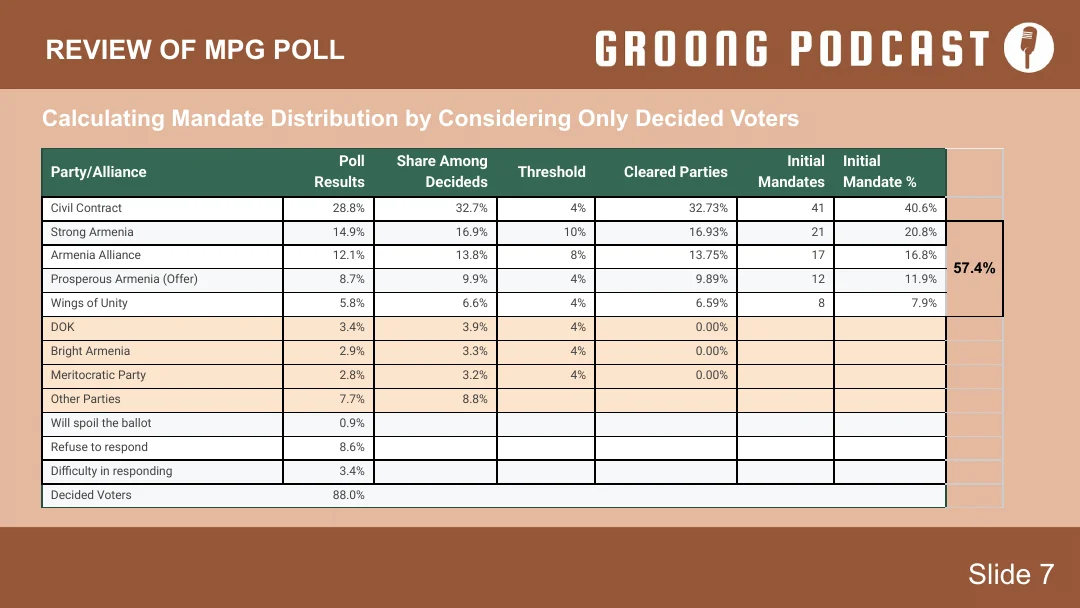
Slide 7: Mandate Distribution Among Decided Voters
This slide models mandate distribution by considering only decided voters and applying threshold rules. In this model, Civil Contract receives 40.6% of initial mandates. Strong Armenia, Armenia Alliance, Prosperous Armenia, and Wings of Unity together reach 57.4%.
| Party / Alliance | Poll Result | Share Among Decideds | Threshold | Initial Mandates | Initial Mandate % |
|---|---|---|---|---|---|
| Civil Contract | 28.8% | 32.7% | 4% | 41 | 40.6% |
| Strong Armenia | 14.9% | 16.9% | 10% | 21 | 20.8% |
| Armenia Alliance | 12.1% | 13.8% | 8% | 17 | 16.8% |
| Prosperous Armenia | 8.7% | 9.9% | 4% | 12 | 11.9% |
| Wings of Unity | 5.8% | 6.6% | 4% | 8 | 7.9% |
| DOK | 3.4% | 3.9% | 4% | 0 | 0.0% |
| Bright Armenia | 2.9% | 3.3% | 4% | 0 | 0.0% |
| Meritocratic Party | 2.8% | 3.2% | 4% | 0 | 0.0% |
| Other Parties | 7.7% | 8.8% | |||
| Will spoil the ballot | 0.9% | ||||
| Refuse to respond | 8.6% | ||||
| Difficulty responding | 3.4% | ||||
| Decided Voters | 88.0% |
Opposition mandate total shown: 57.4%
Key point: Under this model, the opposition could form a majority if these numbers held and if the relevant parties cooperated after the election.
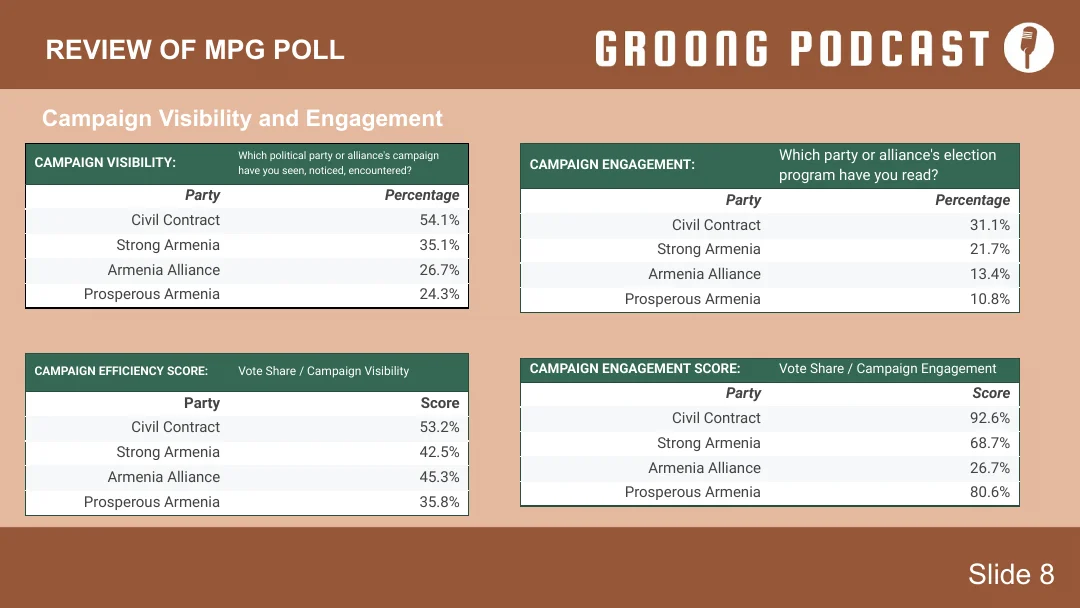
Slide 8: Campaign Visibility and Engagement
This slide compares campaign visibility, program readership, and conversion into vote share. Civil Contract leads in both visibility and engagement. Strong Armenia has lower visibility than Civil Contract but a sizable vote share. Prosperous Armenia has a high engagement score relative to how many people say they have read its program.
Campaign visibility
| Party | Visibility |
|---|---|
| Civil Contract | 54.1% |
| Strong Armenia | 35.1% |
| Armenia Alliance | 26.7% |
| Prosperous Armenia | 24.3% |
Campaign engagement
| Party | Read Election Program |
|---|---|
| Civil Contract | 31.1% |
| Strong Armenia | 21.7% |
| Armenia Alliance | 13.4% |
| Prosperous Armenia | 10.8% |
Campaign efficiency score: vote share / campaign visibility
| Party | Score |
|---|---|
| Civil Contract | 53.2% |
| Strong Armenia | 42.5% |
| Armenia Alliance | 45.3% |
| Prosperous Armenia | 35.8% |
Campaign engagement score: vote share / campaign engagement
| Party | Score |
|---|---|
| Civil Contract | 92.6% |
| Strong Armenia | 68.7% |
| Armenia Alliance | 26.7% |
| Prosperous Armenia | 80.6% |
Key point: Civil Contract’s campaign is the most visible, but visibility alone does not map cleanly onto vote share. Strong Armenia and Prosperous Armenia show notable conversion from engagement into support.
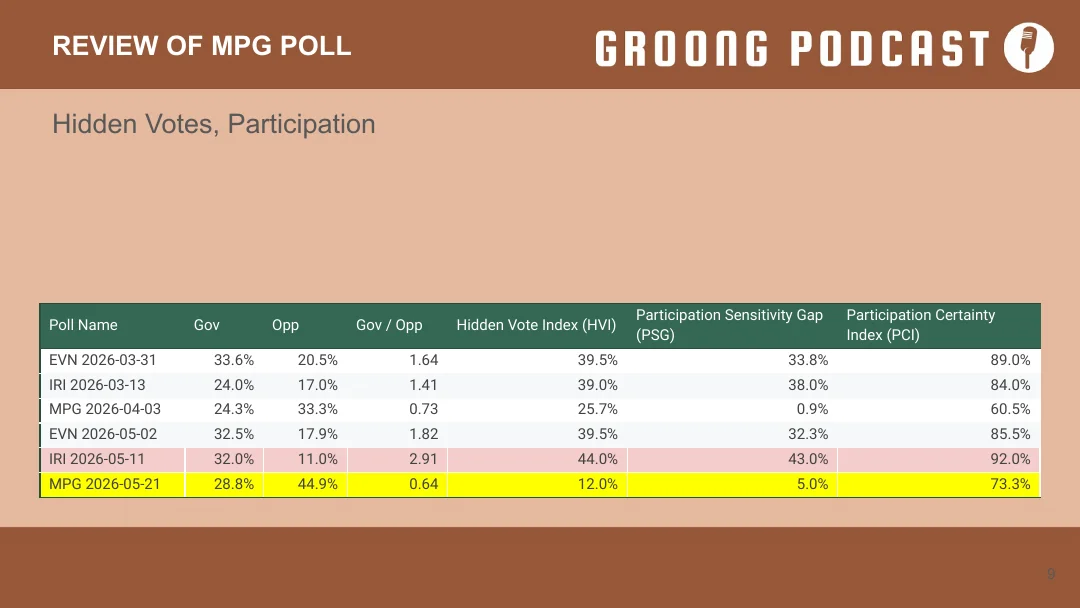
Slide 9: Hidden Votes and Participation Across Polls
This is the central comparison slide. It compares government support, opposition support, government-to-opposition ratio, Hidden Vote Index, Participation Sensitivity Gap, and Participation Certainty Index across recent EVN, IRI, and MPG polls.
| Poll | Gov | Opp | Gov / Opp | HVI | PSG | PCI |
|---|---|---|---|---|---|---|
| EVN 2026-03-31 | 33.6% | 20.5% | 1.64 | 39.5% | 33.8% | 89.0% |
| IRI 2026-03-13 | 24.0% | 17.0% | 1.41 | 39.0% | 38.0% | 84.0% |
| MPG 2026-04-03 | 24.3% | 33.3% | 0.73 | 25.7% | 0.9% | 60.5% |
| EVN 2026-05-02 | 32.5% | 17.9% | 1.82 | 39.5% | 32.3% | 85.5% |
| IRI 2026-05-11 | 32.0% | 11.0% | 2.91 | 44.0% | 43.0% | 92.0% |
| MPG 2026-05-21 | 28.8% | 44.9% | 0.64 | 12.0% | 5.0% | 73.3% |
Hidden vote comparison
| Poll Pattern | Hidden Vote Index | Opposition Support |
|---|---|---|
| EVN 2026-03-31 | 39.5% | 20.5% |
| IRI 2026-03-13 | 39.0% | 17.0% |
| EVN 2026-05-02 | 39.5% | 17.9% |
| IRI 2026-05-11 | 44.0% | 11.0% |
| MPG 2026-05-21 | 12.0% | 44.9% |
Key point: The polls with the highest hidden vote levels show the lowest declared opposition support. The poll with the lowest hidden vote level, MPG May 21, shows the highest declared opposition support. This does not prove which poll is correct, but it strongly suggests that the polls may be measuring not only voter preference, but also voter willingness to disclose preference.
Links Referenced During The Show
- U.S. State Department Public Schedule, May 26, 2026
- Hakob Badalyan on Rubio Visit and Regional Context
- IRI Armenia Public Opinion Survey, May 2026
- CAEAC Focus Poll via California Courier
- Poll Integrity Dashboard Calculations
- Criticism of the IRI Poll
- “Return to Western Azerbaijan” Festival in Nakhichevan
- Aliyev Sticks to Demands for Return of “Western Azeris” to Armenia
- Factor.am Report on Andranik Tevanyan Case
- 7or.am
- Kavkaz Uzel Report on Armen Hovannisyan
- Human Rights Watch: Detainee’s Death in Armenia Raises Serious Questions
- Azatutyun Report on Armen Hovannisyan
- Azatutyun Report on Arthur Osipyan and Pashinyan Campaign Incident
- CivilNet: Pashinyan Threatens to Nationalize Ararat Cement
- Arminfo Report on Ararat Cement Investigation
Wrap-up
Links and Resources
That’s our show , we hope you found it helpful. We invite your feedback and your suggestions, you can find us on most social media and podcast platforms.
Thanks to Laura Osborn for the music on our podcasts.
Hosts

Asbed Bedrossian
Asbed Bedrossian is an IT professional, and for years oversaw the central IT enterprise infrastructure and services at USC. His decades of experience spanned across IT strategy, enterprise architecture, infrastructure, cybersecurity, enterprise applications, data center operations, high performance computing, ITSM, ITPM, and more.
Asbed founded the Armenian News Network Groong circa 1989/1990, and co-founded the ANN/Groong podcast in 2020.
Hovik Manucharyan
Hovik Manucharyan is an information security engineer who moved from Seattle to Armenia in 2022. He co-founded the ANN/Groong podcast in 2020 and has been a contributor to Groong News since the late 1990s.
Disclaimer: The views expressed by Hovik Manucharyan on the ANN/Groong podcast are his own and do not necessarily reflect the opinions of his employer or any other organization.